
 village
Data Visualization
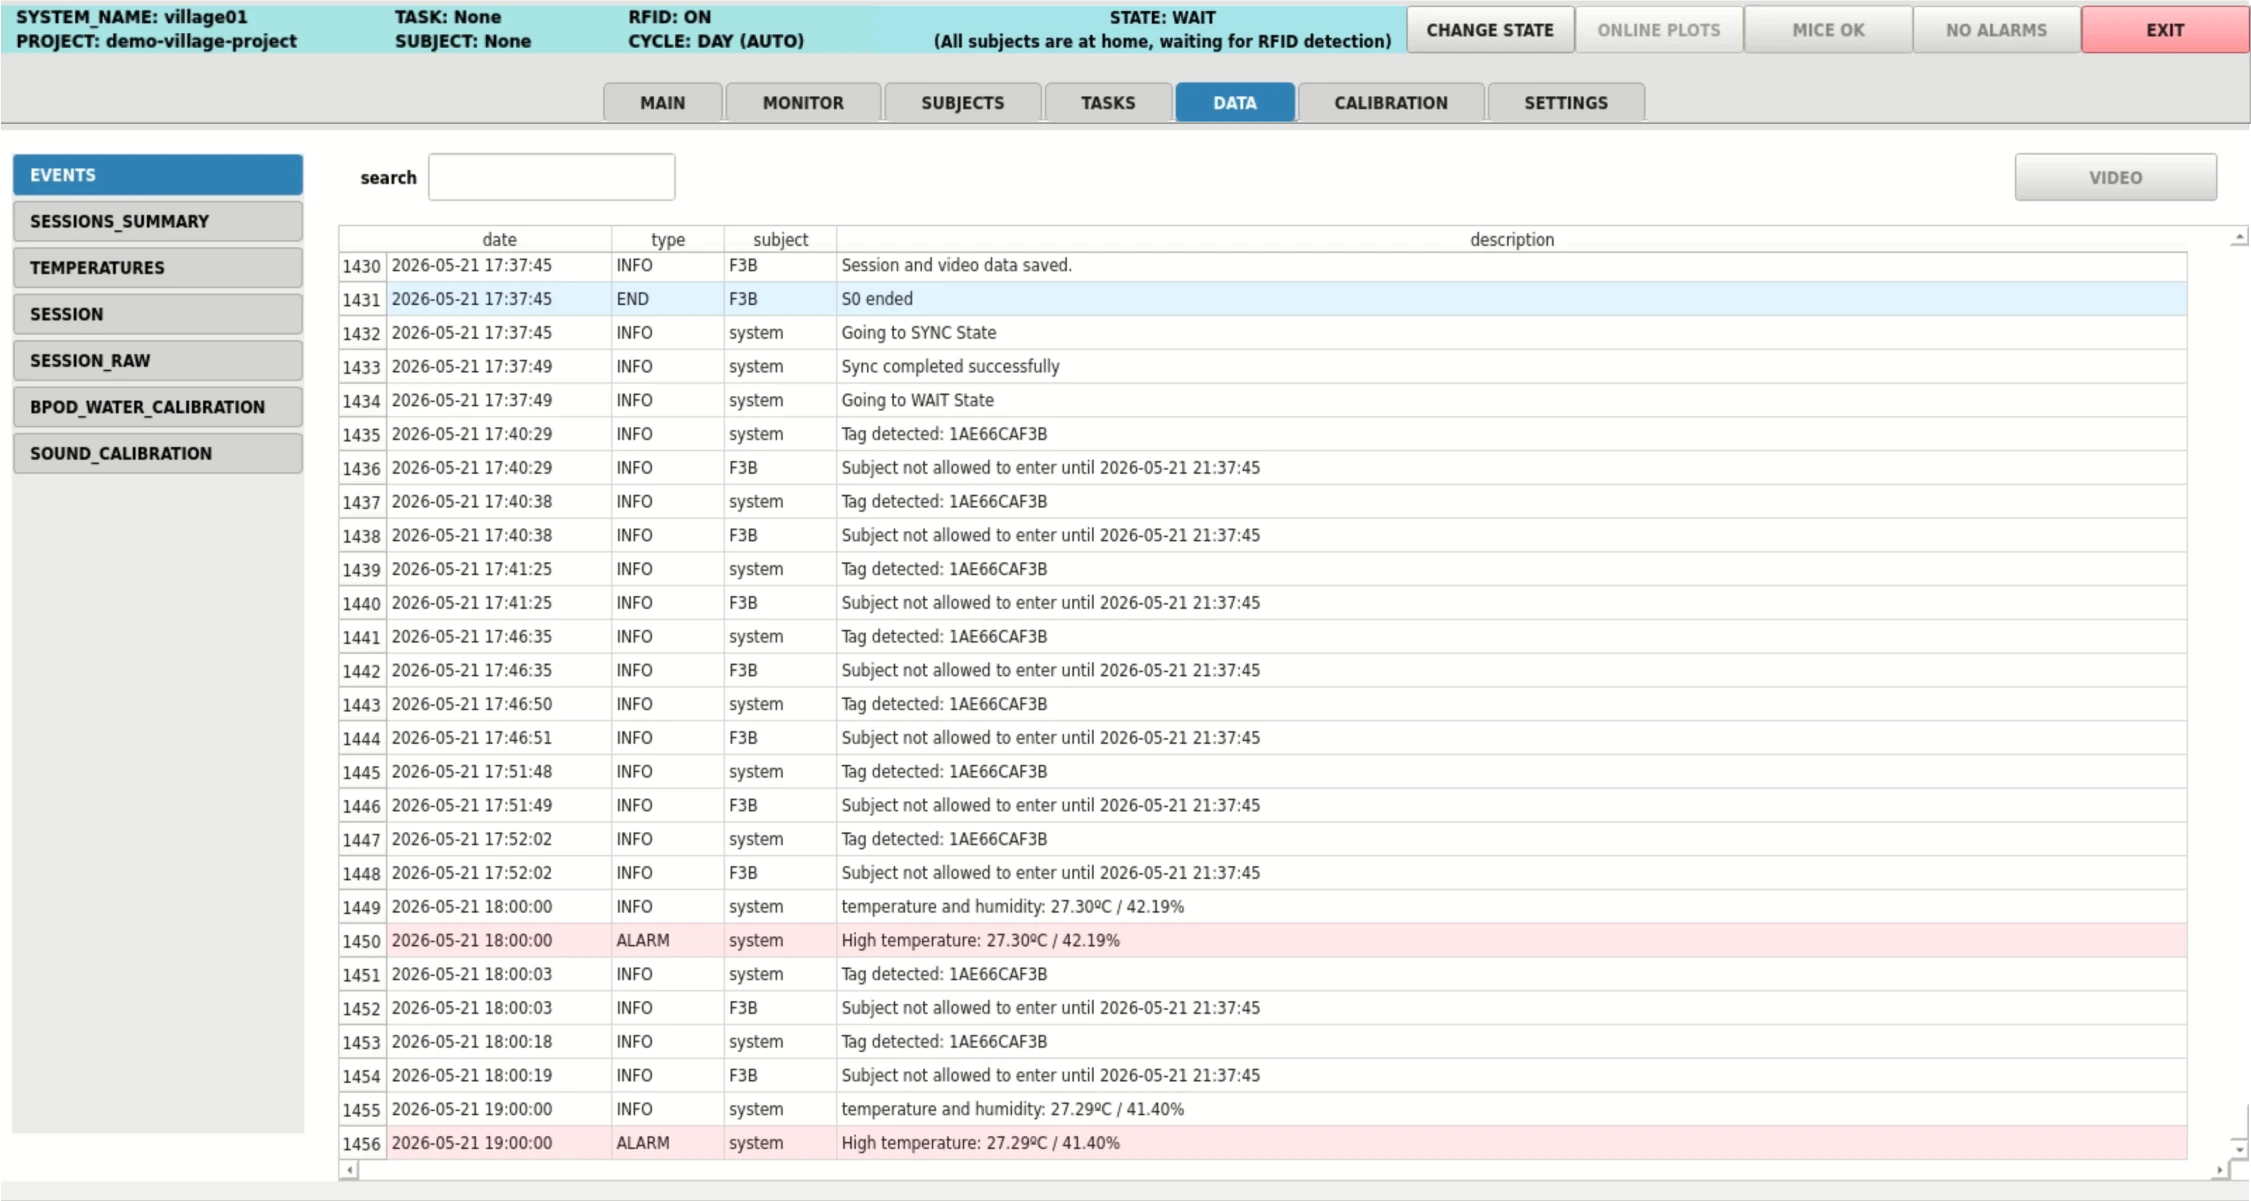
The DATA screen shows the data saved by the system as tables, which can be searched,
plotted, and used to open the videos. The files behind these tables, their columns and
where they are stored are described in Saved Data and Video.
Select a table in the left-side menu, and use the search box to filter its rows. The buttons at the top change with the table, and most act on the selected row.
EVENTS
The log of everything that happens in the system: animal detections, entries and exits, denied entries and their reason, sessions, alarms and errors.
Double-click a row to see its full description and, for errors, the Python traceback with the line of code that failed.
VIDEOopens the corridor video at the moment of the selected event, to see what happened (for example, why an animal was not let in).
SESSIONS_SUMMARY
One row per finished session: date, subject, weight, task, duration, trials, water and settings.
DATAandDATA RAWopen the trial-by-trial and the event-by-event files of the selected session. From there,<-- BACKreturns to the summary.VIDEOopens the video of the session.PLOT SESSIONdraws the session plot of the selected session, andPLOT WEIGHTSthe weights of the subjects.DELETEmarks the selected session as deleted: it disappears from the summary and from the subject’s history, but no file is removed (see Saved Data and Video).Double-click the
settingscell of a session to see the settings it ran with, and to edit itsobservations, a free text field saved with it.
TEMPERATURES
The hourly temperature and humidity log. PLOT draws it over time.
SESSION and SESSION_RAW
The session currently running (or the last one), trial by trial (SESSION) or event by
event (SESSION_RAW), updated as the session advances. To plot a running session, use
ONLINE PLOTS in the toolbar.
Calibrations
One table for each active calibration that stores data (e.g. WATER CALIBRATION,
SOUND CALIBRATION, and any custom calibration), with all its saved measurements.
PLOT draws the calibration curves.
Plots
The plots are the ones of your project (see Plotting), so they can be changed to show what matters in your experiments:
Plot |
Where |
Defined by |
|---|---|---|
Session plot |
|
|
Subject plot |
|
|
Online plot |
|
|
The temperatures and weights plots are built in.
Videos
Every session records a video of the box, and the corridor camera records all the time.
From the DATA screen, open the video of a session (VIDEO in SESSIONS_SUMMARY) or
the corridor at the moment of an event (VIDEO in EVENTS). The video player has
buttons to play and pause, change the speed, and move frame by frame, by 10 seconds or
by 5 minutes, and to jump to the previous or next video.